Visualizing protein-protein interactions in plants
To gain insight into protein-protein interactions that occur in planta, we expanded the interaction assay toolkit. We have developed Knocksideways in plants (KSP) as an imaging-based protein-protein interaction assays to visualize binary as well as higher-order interactions by. KSP can be compared to an intracellular Co-IP experiment. The tool uses the ability of rapamycin to alter the localization of a bait protein and its interactors via the heterodimerization of FKBP and FRB domains. KSP is inherently free from many limitations, which other PPI systems hold. It is an in vivo in planta tool, it is flexible concerning the orientation of protein tagging as long as this does not interfere with the interaction and it is compatible with a broad range of fluorophores. KSP is also a conditional tool and therefore does not require additional controls.
We so far have generated anchor constructs targeting the FRB* domain to the plasma membrane, the mitochondria, the nucleus and the microtubule cytoskeleton. We have also developed scripts fro imageJ that allow to quantify the ineractions.
Next to transient expression in N. benthamiana, we have also shown that the system works in stable Arabidopsis lines.
Winkler et al., The Plant Cell 2021 PMID: 33793859
Dragwidge et al., Nature Cell Biology 2024 PMID: 38347182
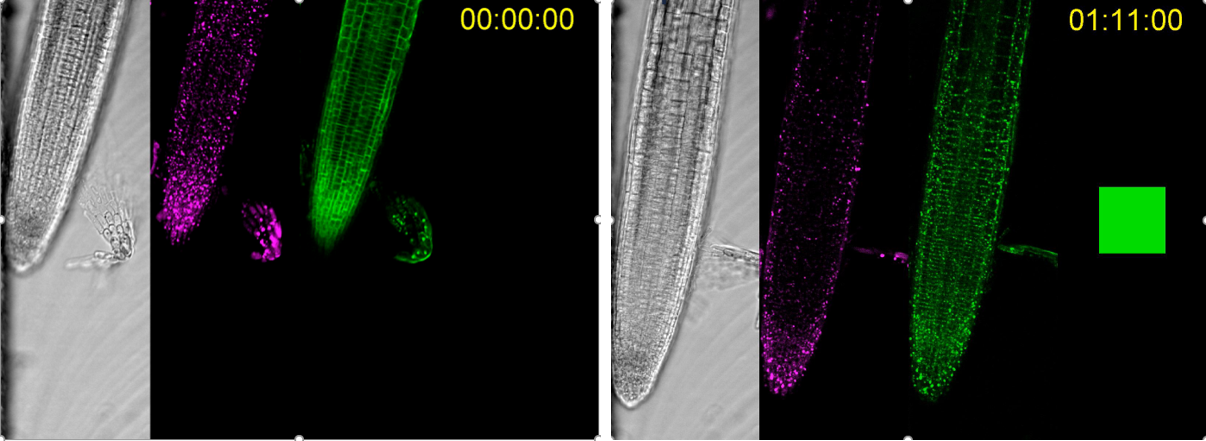
KSP in Arabidopsis using a microfluidics setup. DIC in grey, mitochondria targeted FRB in magenta and TPLATE-mCherry-FKBP in green. The left image is without rapamycin, the image on the right shows relocalization of TPLATE from the PM to the mitochondria in the presence of rapamycin. Time series courtesy of Matyas Fendrych.
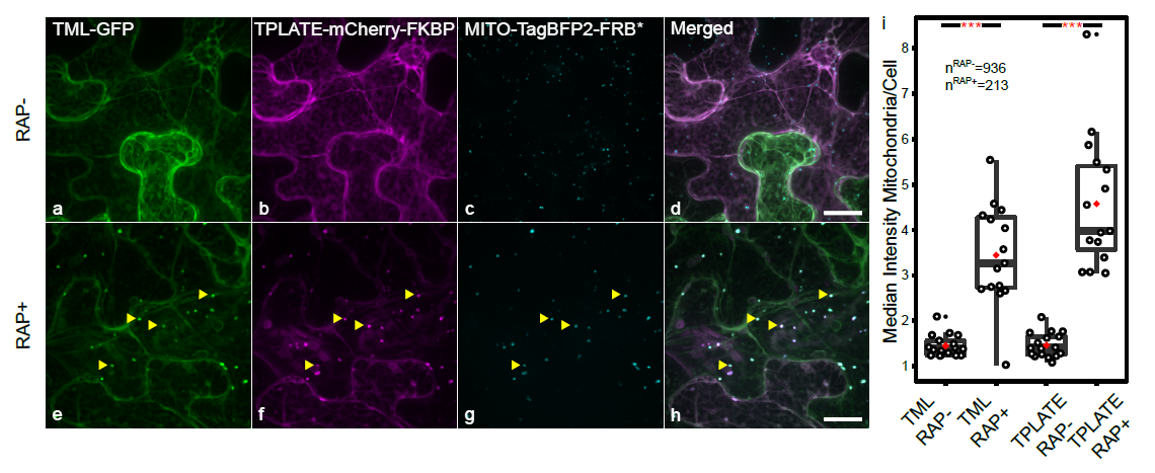
KSP in N. benthamiana. Mitochondrial relocalization of TPLATE-mCherry-FKBP is accompanied by mitochondrial relocalization of TML-GFP, proving interaction between TPLATE and TML. Relocalization of both markers is quantified on the right by making the ratio of the fluorescence intensity at the mitochondria over the fluorescence intensity in the cytoplasm. Quantification is done semi-automatically using home-made scripts. Image adapted from (Winkler et al., 2021).