MitTally (Mitochondria Tally marks)
The script is automatically calculating intensity ratios of a particular channel ‘particle’ (mitochondrion) area versus the cell area within the user’s pre-defined region of interest (ROI). The cell area excludes particle areas from the calculation. Particle areas are generated on the basis of the ‘Mito channel’ via automatic mitochondria recognition. This script is published in Winkler et al., 2021.
https://github.com/winkler-joanna/MitTally_NucTally
NucTally (Nuclear Tally marks)
The script is automatically calculating intensity ratios of a particular channel ‘nucleus’ area versus the cell area within user’s pre-defined region of interest (ROI). The cells areas exclude nuclei areas. Nuclei areas are generated on the basis of the ‘Nucleus channel’ automatically or can be pre-defined by the user. This script is published in Winkler et al., 2021.
https://github.com/winkler-joanna/MitTally_NucTally
PM over cytoplasm ratio calculator
The script uses the PI staining in the red channel as a mask to allow automatic detection of PM and cytoplasm regions in the GFP channel. GFP and PI images are merged together in Fiji. Cells are manually annotated and stored in the Fiji ROI Manager. The script automatically measures the top 5% mean intensity pixels of the channel 2 (GFP) in the detected PM and cytoplasm ROI of each annotated cell based on the PI signal in channel 1 (PI). This script is published in Grones et al., 2022.
https://github.com/pegro-psb/Cyto-PM-signal-quantification
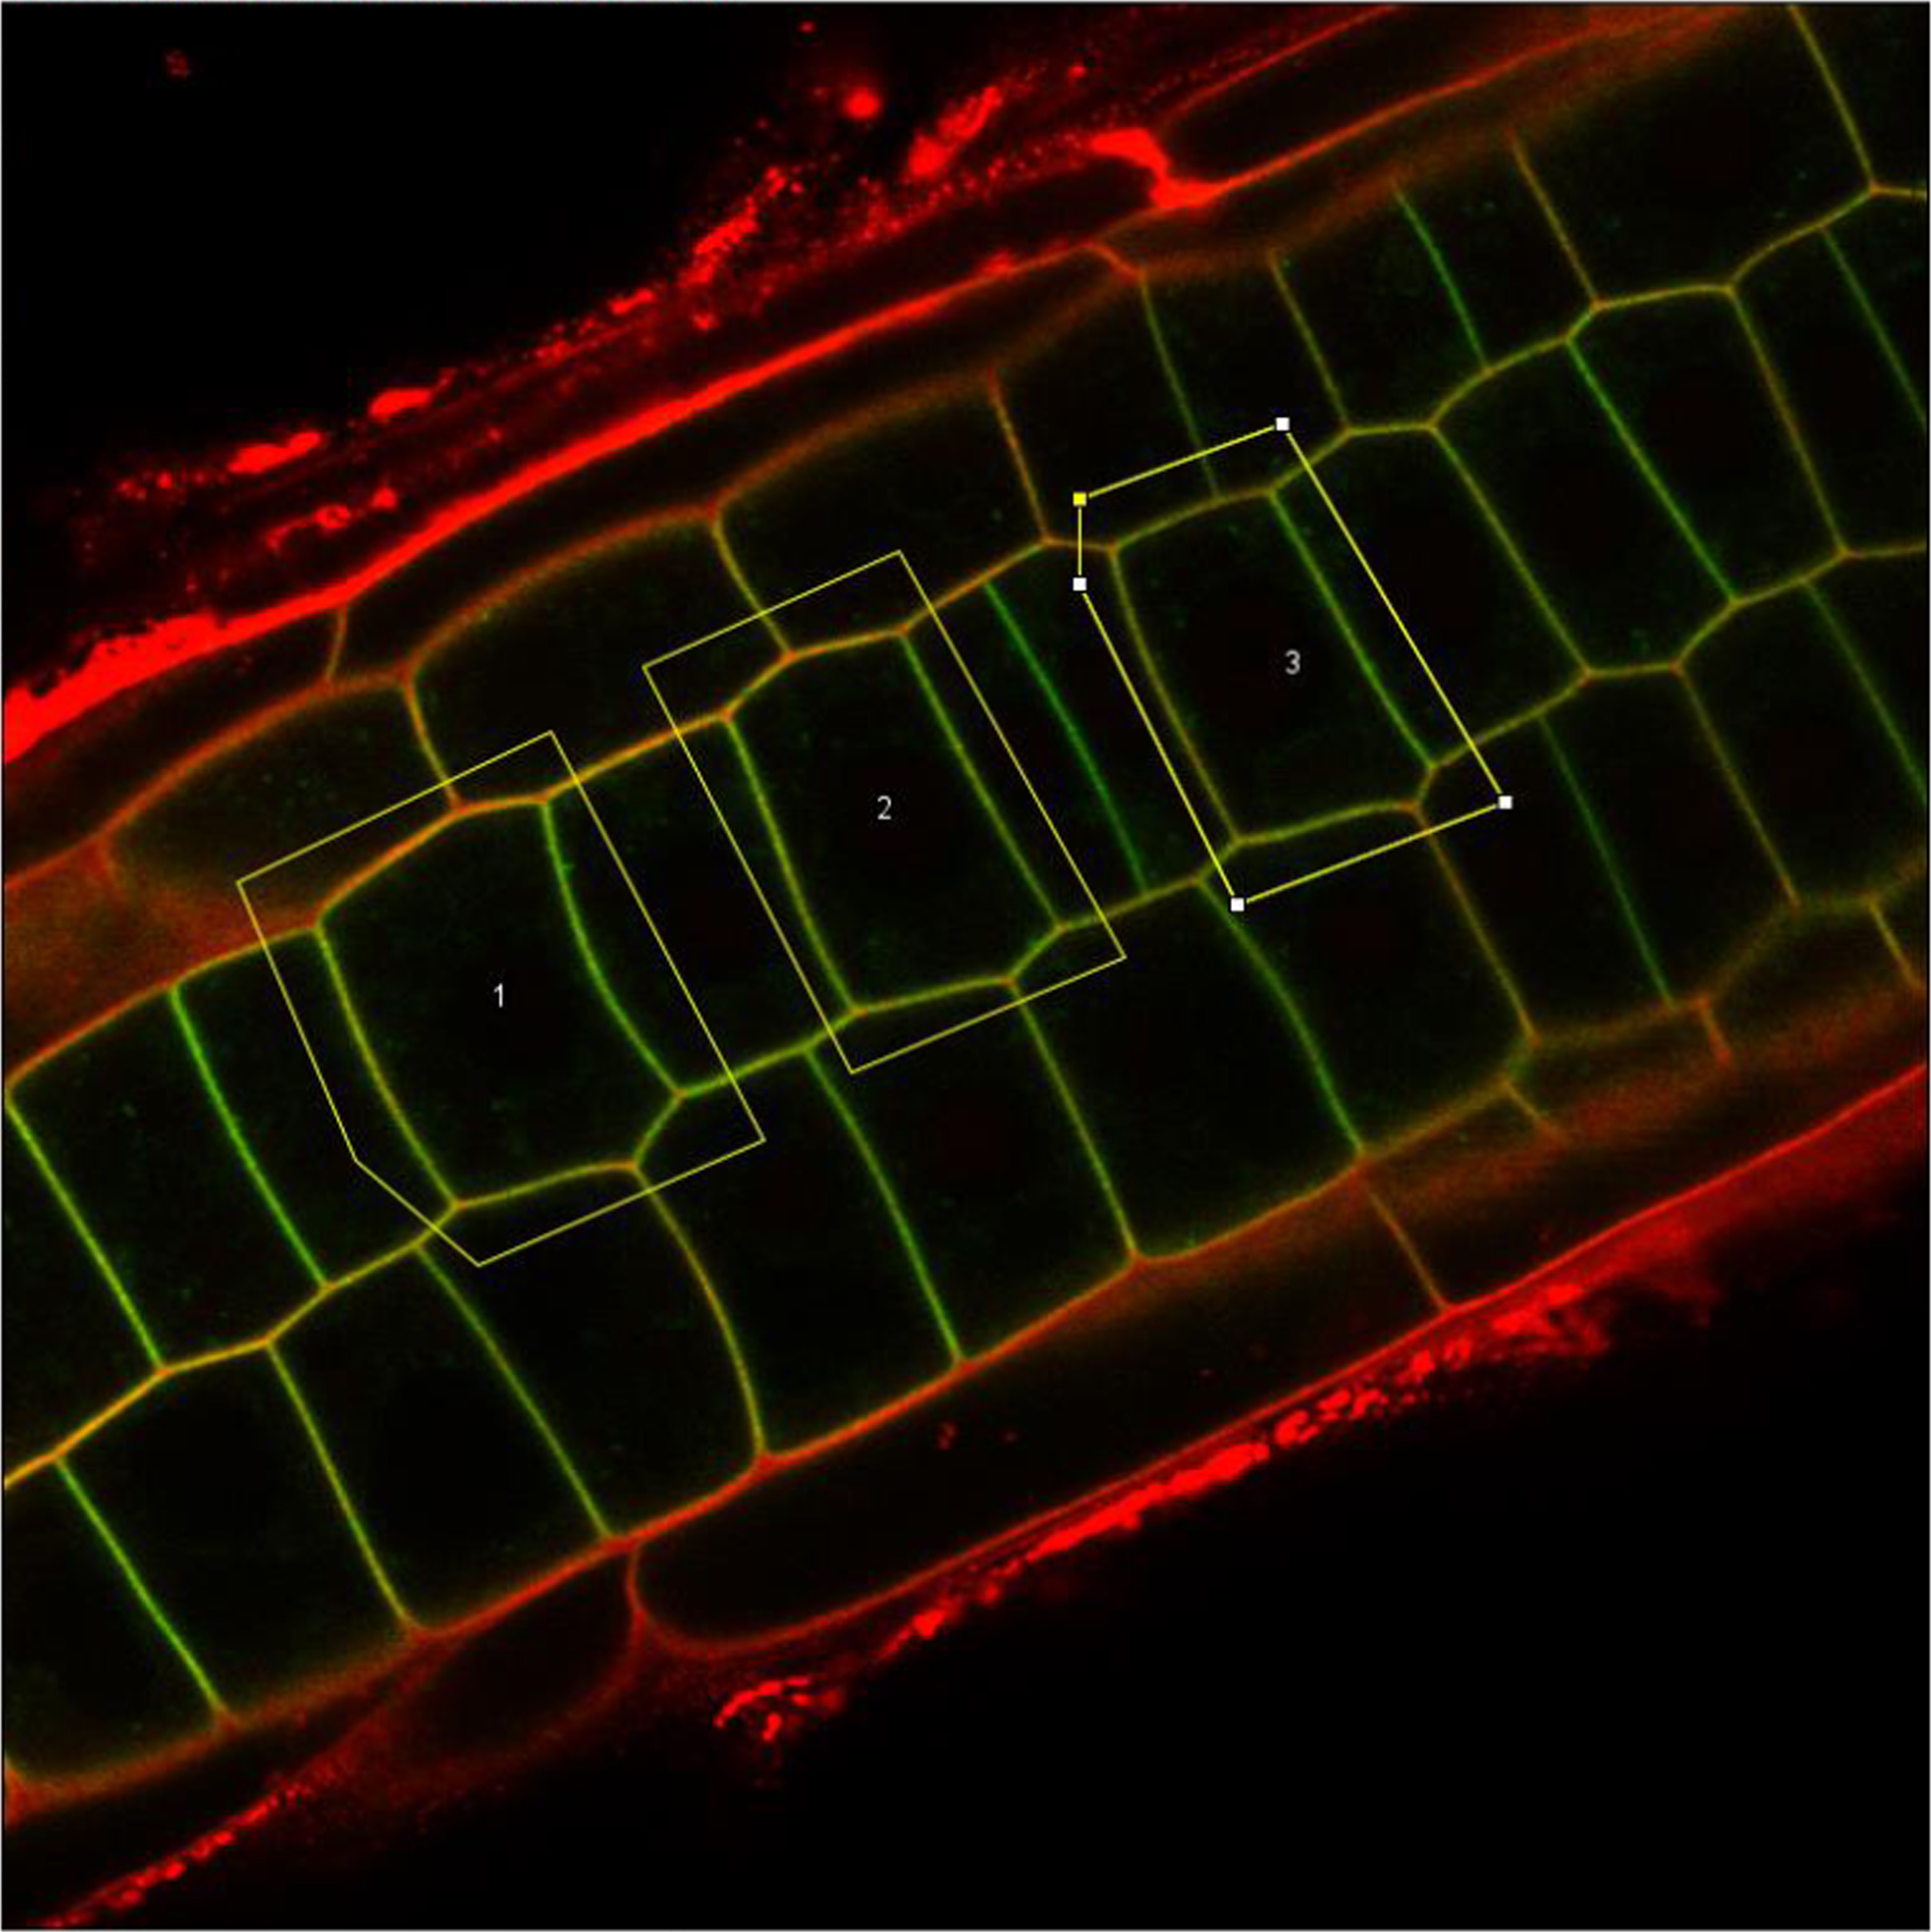
Example merged image of an Arabidopsis root cell expressing a GFP marker (green) and stained wiht PI (red) where three cells are manually selected. the script will then use the PM mask in the red channel to calculate the fluorescence intensity of the PM and the cytoplasm in the green channel of each selected cell.